


To reduce MTTR (mean time to remediate), focus on reducing the time your team spends detecting problems, triaging alerts, testing fixes, and deploying changes. In software environments, these steps usually account for more of the delay, especially when the fix itself is the shortest step.
Fact Check: According to Edgescan’s 2025 Vulnerability Statistics Report, teams take an average of 54.8 days to remediate high- and critical-severity device/network vulnerabilities while high and critical application/API vulnerabilities take an average of 74.3 days to fix. These figures reflect averages from the report’s dataset, not universal averages for all organizations. During this time, affected systems may remain exposed while teams assess risk, coordinate approvals, and roll out patches.
Teams need measurement rules, visibility into affected endpoints, and workflows that move issues from detection to verified resolution in order to improve MTTR. This guide explains how to measure MTTR, identify the bottlenecks that stretch each stage, and use automation to improve patch management, vulnerability remediation, software deployment, and script execution.
Ready to see your own MTTR improve? Start free with up to 200 endpoints or request a demo to see how Action1 helps your team identify and remediate vulnerabilities faster across on-premises and remote endpoints.
What is MTTR?
MTTR is the average time between detecting a software problem and verifying that it has been fixed. The problem can be a failed deployment, a broken update, an exploitable vulnerability, or a crashed service.
The catch is that the “R” stands for four different words: repair, recovery, remediate, and resolve. Different industry sources provide different definitions for these terms, depending on what they consider the start and stop events for each. Your team must also define the start and end points for each before comparing results across incidents, applications, or reporting periods.
This guide focuses on two variations:
| Metric | Used For | Clock Start and End |
|---|---|---|
| Mean time to remediate | Vulnerabilities and patches | The clock covers a CVE from detection to a verified fix. |
| Mean time to resolve | Software incidents | The clock runs from the moment users or systems feel the impact until the service works again and the cause is handled. |
Keep the two separated in your reports. A 20-minute rollback and a 52-hour fleet-wide patch cycle should not share an average.
Where MTTD and MTTA Fit into MTTR Reduction
MTTR captures the time needed to remediate or resolve an issue, but it does not tell you how long the problem went unnoticed or waited for someone to act. These metrics help expose those delays.
| Metric | What it measures | Software example | What it tells you |
|---|---|---|---|
| MTTD (mean time to detect) | Average time from a problem occurring to its detection | A new CVE affects a browser on 800 endpoints. Your next scan finds it six days later. | How quickly monitoring and security tools identify problems |
| MTTA (mean time to acknowledge) | Average time from an alert being raised to a person, or an automated workflow, acknowledging it | A failed-deployment alert sits in a queue for three hours before anyone picks it up. | How well routing, on-call and ownership work |
| MTTR (mean time to remediate or resolve) | Average time from the defined start point, say detection, to verified remediation or resolution | A team takes 52 hours to patch and verify a critical operating system vulnerability fleet-wide. | How efficiently your remediation pipeline works end to end |
| MTBF (mean time between failures) | Average operating time between successive failures in a software service | A service experiences failures every 300 hours of operation, on average. | How frequently a process or service fails over time |
For a vulnerability, MTTD plus MTTR equals the full exposure window; the stretch of time an attacker has an open door that you could have closed. This equation works only when the two metrics use compatible start and stop points. For example, MTTD needs to start when the endpoint actually becomes vulnerable, and MTTR needs to end at verified remediation. Otherwise, adding them won’t necessarily give you the full exposure period.
So, if a vulnerability is present but goes undetected for 10 days, and the team takes another 20 days to remediate it, the exposure window is 30 days. Cutting MTTR from 20 days to 5 helps. But it is equally important to track and reduce MTTD.
Mean Time to Remediate in Patch and Vulnerability Management
Mean time to remediate measures how long your organization takes to eliminate a software vulnerability or apply a required security fix. Unlike incident MTTR, which often starts when a service problem is detected, vulnerability remediation needs a clearly defined starting event.
For example, you might start the clock when a Common Vulnerabilities and Exposures (CVE) entry is published, when your vulnerability scanner first detects the issue, or when your endpoint management platform identifies an affected application. These starting points measure different things: time since public disclosure, time since internal discovery, or time since the affected endpoint was identified. Choose an event and apply it consistently to reporting.
The clock stops only when the fix has been successfully deployed and verified on every in-scope affected endpoint. A deployment report showing that 95% of endpoints are patched is not complete remediation. Keep the vulnerability open until the remaining 5% is resolved or formally handled under your documented risk-acceptance process. However, accepting a vulnerability’s risk doesn’t mean the vulnerability has been remediated. The organization may decide not to fix it, but that decision should remain distinguishable from a verified technical fix in the reporting.
This is where vulnerability MTTR differs from incident MTTR. A software incident may cause an outage or disrupt a deployment. An unpatched vulnerability can remain open without any visible disruption, in which case the key concern is how long your systems remain exposed, not how long a service stays unavailable.
Why Reducing MTTR Matters
A low vulnerability count means little if the items on the list are critical, actively exploited, or months overdue for remediation. A pipeline that clears the easy findings and stalls on the hard ones can post a great count and a terrible MTTR.
The business impact is direct. A long MTTR means more downtime, lower availability, missed service level agreements (SLAs) and lost customer trust. When a bad update takes down a line-of-business application, every hour of prolonged diagnosis drains revenue and floods the helpdesk. Good incident management shortens that window and shows users the problem is under control.
The security impact is just as direct. A long MTTR widens the exposure window, and the probability of an attacker exploiting a known vulnerability rises with every day it stays open. Timely, verified remediation also provides evidence of compliance during an audit.
Tracking how long issues stay open helps you see whether your team is reducing risk.
The Cost of Downtime and Slow Remediation
According to New Relic’s 2025 Observability Forecast, high-impact IT outages now carry a median cost of $2 million per hour, roughly $33,333 for every minute systems remain down. On the exposure side, Edgescan’s 2025 Vulnerability Statistics Report found, within its dataset, that organizations take an average of 54.8 days to remediate high- and critical-severity network and device vulnerabilities, from detection to verified remediation. These figures illustrate two different costs of delay: lost business activity and prolonged security exposure.
Now compare 54.8 days with how fast attackers move. Google’s Mandiant tracks time to exploit, the average time between a vulnerability’s patch release and its first known exploitation, including exploitation that occurs before a patch is available. Mandiant found that the average time to exploit fell from 63 days in 2018-19 to just 5 days in 2023. Mandiant excluded 15 statistical outliers from the 2023 figure. With them included, the average was 47 days.
Every extra day of MTTR is another day attackers can exploit a vulnerability you already know about.
SLA and Compliance Remediation Deadlines
Compliance frameworks turn MTTR from an internal metric into an audit question. Only a few of them set a deadline for patching every vulnerability. Some specify patching windows, while others require risk-based controls, documented remediation, or timely incident reporting. Several of them hold you to the timeline you wrote down, so you need a documented policy and the data to prove you met it.
| Framework | What it requires | Remediation timeline |
|---|---|---|
| CISA KEV and BOD 26-04 | CISA (Cybersecurity and Infrastructure Security Agency) maintains the KEV (Known Exploited Vulnerabilities) catalog. BOD (Binding Operational Directive) 26-04, issued June 10, 2026, replaced BOD 22-01 and BOD 19-02. US federal civilian agencies must remediate on a risk-tiered schedule based on public exposure, KEV listing, automatability, and technical impact. | 3 days for the highest-risk combinations (some also require forensic triage), 14 days, 60 days, or at the next system upgrade for the lowest risk. BOD 22-01 had set two weeks for most KEV entries. |
| PCI DSS 4.0.1 | The Payment Card Industry Data Security Standard, requirement 6.3.3: install critical or high-security patches within one month of release, using the risk ranking from requirement 6.3.1. High-risk vulnerabilities must be handled according to the entity’s risk assessment and vulnerability-ranking process. | 30 days for critical. Other patches within a time frame set by your organization’s risk assessment. |
| HIPAA Security Rule | The Security Rule requires covered entities and business associates to assess risks and implement measures that reduce risks to electronic protected health information to a reasonable and appropriate level. |
No fixed deadline in force. Set risk-based internal deadlines and document remediation decisions. A January 2025 proposed update would require critical vulnerabilities to be remediated within 15 calendar days and high-risk vulnerabilities within 30 calendar days. If a suitable patch is available, the clock would start when the need for the fix is identified. If no patch is available, the clock would start when one becomes available. The proposal is not finalized as of this writing. |
| SOX | The Sarbanes-Oxley Act requires effective internal controls over financial reporting. Internal-control requirements can apply to access, change management, and the reliability of financial reporting systems. Auditors test IT general controls, including patching, on systems that feed financial data. | No deadline. Your documented patch policy becomes the standard, and auditors check that you met it. |
| DORA |
The European Union (EU) Digital Operational Resilience Act has applied to financial entities since January 17, 2025. It requires covered financial entities to manage information and communication technology (ICT) risks, handle ICT incidents, and address root causes. Its technical standard (Delegated Regulation 2024/1774, Article 10) requires automated weekly vulnerability scans on assets that support critical or important functions, documented patch deadlines, escalation when deadlines slip, and emergency patching procedures. |
No fixed deadline. You set the deadlines, document them, and defend them. |
| FedRAMP | The Federal Risk and Authorization Management Program requires continuous monitoring of cloud services sold to US agencies. KEV due dates take priority over severity-based ones. | Rev 5 baseline, counted from identification: 30 days for high, 90 for moderate, 180 for low-risk findings. The newer FedRAMP Consolidated Rules for 2026 now specify risk-based vulnerability response timelines that depend on certification class, exploitability, internet exposure, and potential impact. |
Frameworks change, so verify each deadline against the primary source before an audit.
For your MTTR program, map each applicable requirement to a remediation policy, assign owners, and track elapsed time against the relevant deadline. This gives your team evidence of progress and prevents a missed deadline from becoming a compliance problem.
How to Measure MTTR for Software Remediation
To measure MTTR, calculate the average elapsed time for completed software incidents or vulnerability remediations during a defined reporting period. Then segment the results by severity and application to identify where delays are concentrated.
One caveat worth mentioning: completed cases alone don’t tell the whole story. Vulnerabilities that remain open for weeks or months won’t affect the average, even as the backlog grows. Track open vulnerabilities separately, including their age and severity.
Align on One Definition and Clear Start/Stop Points
Write down your MTTR definition and apply it the same way across teams and reporting periods. If one team starts the clock when a vulnerability is detected and another starts when patching begins, their numbers cannot be compared fairly. The same is true if one team stops the clock at “deployed” and another at “verified”.
Use explicit events for each kind of work:
- Patching and vulnerability remediation: Start when the CVE is detected. Stop when the fix is verified on every affected endpoint.
- Software incidents: Start when the incident causes a measurable impact. Stop when the service is restored.
Capture timestamps automatically from vulnerability scanners, patch management platforms, deployment systems, monitoring tools, and ticketing workflows. Manually combining records increases the chance of missing time between stages and makes reporting slower.
MTTR Formula with a Worked Software Example
Calculate MTTR using this formula:
MTTR=Total remediation (or resolution) timeNumber of incidents or vulnerabilities during the period
Suppose your team records three software issues during a reporting period:
| Event | Type | Time to fix |
|---|---|---|
| A failed browser update is rolled back | Incident | 20 minutes |
| A critical operating system CVE is patched on every endpoint | Vulnerability | 52 hours (3,120 minutes) |
| A broken agent deployment is fixed with a script | Incident | 45 minutes |
Convert all times to hours before calculating:
- Browser update: 20 ÷ 60 = 0.33 hours
- Critical vulnerability: 52 hours
- Agent deployment: 45 ÷ 60 = 0.75 hours
Total time: 0.33 + 52 + 0.75 = 53.08 hours
MTTR: 53.08 ÷ 3 = 17.69 hours
That average looks manageable at first glance, but two issues were resolved in under an hour while the critical vulnerability took 52 hours. The mean is influenced by that one long remediation. This is why you should report the mean with the median, 90th percentile (P90), and severity-specific results.
Segment MTTR by Severity and Service
Calculate separate MTTR figures for critical, high, medium, and low-severity issues. Break them down further by application or service. One organization-wide average can hide a slow remediation process for a business-critical application. For example, a fast fleet-wide browser update can mask a database server that has waited 40 days.
Also report the median and P90 along with the MTTR. The median shows the middle value. P90 shows the time within which 90% of issues were resolved, which means 10% take longer. Say you close 200 minor alerts at 30 seconds each, and one incident takes 17 hours. The average comes out under six minutes, and the 17-hour event nearly vanishes. The median and P90 won’t reveal it either, so track the maximum and extreme outliers separately.
What is a Good MTTR? Benchmarks to Aim for
There is no specific MTTR target for every organization. A good target depends on business impact. For example:
- New Relic’s guidance is minutes for revenue-critical services and longer for internal tools. Their 2023 Observability Forecast shows why targets should reflect impact, stating that “High-business-impact outages tend to take the longest to resolve, with 60% saying it takes more than 30 minutes and 34% saying it takes more than an hour to resolve.”
- Reference points for critical vulnerabilities:
| Stage 1: Manual processes | 60–120+ days |
|---|---|
| Stage 2: Semi-automated | 14–30 days |
| Stage 3: Highly automated | Under 7 days |
Use them as directional marks, not industry benchmarks.
For daily operations, start with SLA targets like these and adjust them to your risk and compliance obligations:
| Severity | Starting SLA target |
|---|---|
| Critical and listed in KEV (actively exploited) | 24 to 48 hours |
| Critical | 72 hours |
| High | 14 days or less |
| Medium | 30 days |
| Low | Next patch cycle, 90 days at most |
When Does MTTR Really Stop? Patch Installation vs. Verified Remediation
For vulnerability remediation, MTTR should not stop when a patch is downloaded, deployed or reported as installed. It should stop when the remediation has taken effect and your team has verified the result.
NIST (the National Institute of Standards and Technology) is the authority here. Its guide to enterprise patch management, SP 800-40 Rev. 4, describes the process as identifying, prioritizing, acquiring, installing and verifying the installation of patches. It specifically says that deployment verification should confirm that the patch was successfully installed and took effect. Installation is one step. Verification is a separate one. MTTR covers both.
Teams often treat these states the same thing:
patch assigned → patch downloaded → installation completed → restart pending → restart completed → fix active → vulnerability no longer detected → remediation verified
Every arrow is time. If you stop the clock at “installation completed”, you skip the states where the endpoint is still exposed.
A successful deployment status doesn’t always mean a remediated endpoint. Some operating system updates need a restart before they take full effect. Microsoft Defender Vulnerability Management states that when an update hasn’t completed because of a pending restart, the effect isn’t reflected in your exposure score. It even adds a Pending restart tag so you can find those devices.
The delay between installation and verification is also worth measuring on its own because it can cause real trouble:
- Users postpone required restarts.
- Endpoints sit in a pending restart state for days.
- An update installs but still needs one more action before it takes effect.
- The deployment tool reports success while vulnerability verification is still pending.
- Teams closed remediation tickets too early because deployment status was treated as proof.
For vulnerability remediation, define your MTTR stopping event before you start measuring. If your goal is risk reduction, verified remediation is a more meaningful stop than “deployment completed”. If restart delay is significant in your environment, track the time between installation and activation. That shows you whether deployment or restart behavior is the real bottleneck.
Takeaway: A patch being deployed is not always the same as a vulnerability being remediated. Your MTTR definition should reflect the point at which the fix has taken effect and its success has been verified.
Where Does MTTR Time Get Lost in the Remediation Lifecycle?
Most of your MTTR is spent waiting between stages, not working inside them. The stage model we’ve explored earlier, rewritten as a patch and remediation lifecycle, gives you five places to look: detect → prioritize and triage → test and approve → deploy → verify. Each stage has its own delay, even when the actual fix takes minutes.
- Detection waits for the next scheduled scan. Moreover, incomplete endpoint inventories, missed alerts, and infrequent scans can delay discovery.
- Triage waits for someone to read the report. To add to it, unclear priorities can leave critical vulnerabilities waiting behind routine updates.
- Manual testing and approval queues can extend the test and approve stage.
- Deployment waits for a maintenance window. Offline endpoints, failed installations, and pending restarts can slow progress.
- Verification waits for someone to remember to check. Moreover, missing deployment records or delayed rescans can leave remediation unconfirmed.
Human factors can compound the delays. Unclear ownership, slow decisions, fragmented communication, and incomplete incident records can prolong diagnosis and resolution. Automating routine tasks helps, but automation will not fix a process where no one knows who should approve a patch or investigate a failed deployment.
Here is an illustrative example to show how one stage can dominate. It is the kind of time-loss breakdown the Reddit r/sre thread (a community of site reliability engineers) describes, applied to a failed agent deployment:
| Phase | Time | Share of total | What happened |
|---|---|---|---|
| Alert | 2 minutes | 0.8% | Monitoring flagged failed installs |
| Acknowledge | 38 minutes | 15.7% | Alert waited in a shared queue |
| Investigation | 3 hours 10 minutes | 78.5% | Team searched for which change broke the agent |
| Fix | 12 minutes | 5% | A script reinstalled the agent |
| Total | 4 hours 2 minutes | 100% |
The fix took 12 minutes. The incident took four hours. Investigation alone ate 79% of it, so no amount of faster fixing would have helped much.
Time-Loss Breakdown: One Critical CVE, Before and After Automation
The same pattern shows up in vulnerability work. Take a critical CVE in a third-party application. The table shows how the hours split across the five lifecycle stages with manual handoffs versus automation.
| Stage | Manual (hours) | Share | Automated (hours) | Share | What changed |
|---|---|---|---|---|---|
| Detect | 96 | 18% | 2 | 8% | Weekly scan became continuous |
| Prioritize | 48 | 9% | 1 | 4% | KEV and exposure flags rank the CVE on arrival |
| Test and approve | 120 | 23% | 8 | 31% | Pre-approved policy plus a pilot ring replaced the change board |
| Deploy | 216 | 41% | 12 | 46% | No wait for a maintenance window |
| Verify | 48 | 9% | 3 | 12% | Automatic rescan replaced a manual spot check |
| Total | 528 (22 days) | 100% | 26 (about 1 day) | 100% | 95% shorter |
Illustrative model of a single critical CVE, not customer data or an industry benchmark. Shares are rounded.
Before automation, 64% of the time (approval plus deployment) was spent waiting for people and windows, not doing technical work. After automation, the stages are shorter.
Escalation and Response-Team Assembly
A CVE alert sits unaddressed while security analysts work out which team owns the affected application or endpoint group. The same problem occurs when a software update fails and the support team cannot identify who maintains the application.
Map applications, endpoint groups, technical owners, and escalation contacts before an incident occurs. Connect those records to your vulnerability and ticketing workflows so a critical finding reaches the right team immediately. Define backup owners and escalation rules for unassigned tickets. This removes administrative delays from incident response and gives remediation work a stable starting point.
Communication Gaps Across Teams
Patch remediation often involves three teams:
- Security identifies the vulnerability
- IT operations deploy the patch
- Application owners assess compatibility and approve changes
If these teams use separate queues or communicate through ad hoc messages, the patch can wait while each team gathers context the others already have.
Effective incident communication keeps work moving. Use shared dashboards, one channel per incident and agreed response times for each handoff. This reduces repeated questions and helps teams move from triage to deployment without unnecessary waiting.
Baseline Each Stage of the Remediation Lifecycle
Capture five timestamps for every vulnerability or software incident: detected, triaged/prioritized, approved, deployed, and verified. Calculate the elapsed time between consecutive timestamps to identify where delays occur.
Use this example as a dashboard template. The figures are illustrative.
| Remediation stage | Median time | P90 time | Potential bottleneck |
|---|---|---|---|
| Detect to triage | 15 minutes | 2 hours | Alert routing or queue delays |
| Triage to approval | 1 hour | 8 hours | Risk assessment or approval waits |
| Approval to deployment | 2 hours | 12 hours | Scheduling or deployment capacity |
| Deployment to verification | 30 minutes | 4 hours | Restart delays or pending scans |
Report these durations by severity and application. The median describes a typical case while P90 reveals how long the slowest 10% of cases take. The medians look fine in the above table, but if approval consistently has the longest P90, start by looking into approval workflows.
Root Cause Analysis and Diagnosis
According to research from The Visible Ops Handbook, up to 80% of mean time to resolution is spent simply figuring out what changed or where the failure originated. For software remediation, the same diagnostic challenge appears when a failed update, patch, or script affects an endpoint group, and teams cannot quickly assess what changed.
Maintain a searchable change history that records the patch or software version, deployment time, affected endpoints, script execution results, and any errors in the logs. When you know exactly which patch, update or script ran on which endpoint and when, root cause analysis shifts from detective work to a lookup.
Fragmented Tools and Context Switching
Using one tool to scan for vulnerabilities, another to deploy patches, and a spreadsheet to report results can create blind spots. Analysts may have to export findings, match endpoint identifiers, chase deployment logs, and manually update tickets before they can confirm remediation.
Connect scanning, deployment, ticketing, and verification workflows wherever possible. A shared record should show the vulnerability, affected endpoints, priority, deployment status, and verification result. This reduces manual reporting and makes it easier to identify endpoints that need attention.
How to Reduce MTTR in Patching and Vulnerability Remediation
To reduce MTTR, you need to detect vulnerabilities early, prioritize the right fixes, remove approval bottlenecks, deploy patches quickly, and verify that remediation worked. The most effective improvements combine automation with ownership and controls for high-risk changes. The following strategies cover the full remediation lifecycle, from detection and triage to verification and continuous improvement.
Automate Patch Deployment and Remediation with Scripts and Runbooks
Automation can remove repetitive manual steps from routine patching. Separate routine updates, such as operating system, browser, and common third-party application patches, from exceptions that need closer review.
- Deploy routine patches through automated policies without requiring individual approval for every update.
- Keep manual review for high-risk applications or changes that could disrupt critical services.
- Use scripts and runbooks for the edge cases, such as restarting a service after an update, clearing a stuck update cache, removing a vulnerable version, or collecting logs when installation fails.
For example, a PowerShell runbook can restart an approved Windows service on a remote server after a successful deployment:
<#
.SYNOPSIS
    Restarts a Windows service on a remote server after a successful deployment
    and verifies that it returns to the Running state.

.DESCRIPTION
    - Skips the restart if the deployment did not succeed.
    - Runs the restart ON the remote machine via PowerShell remoting
      (Invoke-Command), which works in Windows PowerShell 5.1 and PowerShell 7+.
    - Polls the service status until it is Running or the timeout expires.
    - Throws on any failure so the calling runbook/pipeline is marked as failed.

.NOTES
    Requirements:
      - WinRM / PowerShell remoting enabled on the target server.
      - The account running the script must have rights to manage services
        on the target server.
#>

param(
    [string]$ComputerName = "APP-SERVER01",

    [string]$ServiceName = "MyApplicationService",

    [Parameter(Mandatory = $true)]
    [ValidateSet("Success", "Failed")]
    [string]$DeploymentStatus,

    [ValidateRange(10, 600)]
    [int]$TimeoutSeconds = 60,

    [ValidateRange(1, 30)]
    [int]$PollIntervalSeconds = 3,

    # Optional: supply alternate credentials for the remote connection.
    [System.Management.Automation.PSCredential]$Credential
)

$ErrorActionPreference = "Stop"

# Build common remoting parameters once (adds -Credential only when provided).
$remoteParams = @{ ComputerName = $ComputerName }
if ($Credential) { $remoteParams.Credential = $Credential }

try {
    # Proceed only after a successful deployment.
    if ($DeploymentStatus -ne "Success") {
        throw "Deployment failed. Service restart skipped."
    }

    Write-Output "Starting service restart process on '$ComputerName'..."

    # Retrieve the current service status on the remote machine.
    $currentStatus = Invoke-Command @remoteParams -ScriptBlock {
        (Get-Service -Name $using:ServiceName -ErrorAction Stop).Status
    }
    Write-Output "Current status of '$ServiceName': $currentStatus"

    # Restart the service on the remote machine.
    # -Force also restarts any services that depend on this one.
    Invoke-Command @remoteParams -ScriptBlock {
        Restart-Service -Name $using:ServiceName -Force -ErrorAction Stop
    }

    # Wait for the service to reach Running (polling the remote machine).
    $deadline = (Get-Date).AddSeconds($TimeoutSeconds)
    $status   = $null

    do {
        Start-Sleep -Seconds $PollIntervalSeconds

        $status = Invoke-Command @remoteParams -ScriptBlock {
            (Get-Service -Name $using:ServiceName -ErrorAction Stop).Status
        }

        Write-Output "Service status: $status"
    } until ($status -eq "Running" -or (Get-Date) -ge $deadline)

    # Verify the final service status.
    if ($status -ne "Running") {
        throw "Service '$ServiceName' did not reach 'Running' within $TimeoutSeconds seconds (last status: $status)."
    }

    Write-Output "SUCCESS: Service '$ServiceName' restarted and is running on '$ComputerName'."
}
catch {
    Write-Error "Runbook failed: $($_.Exception.Message)" -ErrorAction Continue
    throw
}
Test the runbook on a pilot group before production use. Track median remediation time, deployment success rate, and failed-runbook rate to measure your results.
Cut Detection Time with Continuous Scanning and Anomaly Detection
Monthly scans can leave newly introduced vulnerabilities undiscovered for weeks. Daily agent-based scanning can shorten that window, with third-party vendors describing a reduction in mean time to detect (MTTD) from weeks to within 24 hours. Ensure that the agents send regular heartbeats, endpoint inventories stay current, and findings automatically create or update remediation tickets.
For software incidents, configure monitoring to notify your team when deployments fail, error rates rise, or an application behaves differently from its baseline. AI-assisted anomaly detection learns what normal looks like in your metrics, then logs and flags the deviations. Observability tools can connect alerts with recent changes and logs.
To confirm that continuous scanning and anomaly detection are cutting detection time, measure the time from issue occurrence or disclosure to detection, plus the percentage of failed deployments automatically.
Build Incident Playbooks with Severity Levels and Escalation Paths
Define severity tiers and link each one to a pre-approved playbook. Each playbook should state the first diagnostic steps, accountable owner, communication channel, escalation deadline, and conditions for rollback. This gives responders a path instead of making them decide what to do while an incident is unfolding.
Use the following matrix as a starting point. The response comes from New Relic’s example for incident severities, and the patch SLAs follow the targets given earlier in this guide.
| Severity | Example (software) | Patch or response SLA | Who is paged |
|---|---|---|---|
| 1 (critical) | A KEV-listed vulnerability on internet-facing systems, or a failed deployment that takes a core app down for all users | Acknowledge in 5 minutes. Mitigate incidents in 30 minutes. Patch KEV-listed flaws in 24 to 48 hours. | On-call engineer, security lead, IT manager |
| 2 (high) | A critical CVE with no known exploit, or a bad update that breaks a business-critical application | Acknowledge in 15 minutes. Mitigate in 2 hours. Patch within 72 hours. | On-call engineer, application owner, security and IT operations |
| 3 (medium) | A high-severity CVE, or one endpoint group failing the same update repeatedly | Patch within 14 days. | Endpoint team queue |
| 4 (low) | A medium or low CVE, or a cosmetic update issue | Next patch cycle, 30 to 90 days. | Ticket only, no page |
These are example internal targets, not universal regulatory deadlines. Track acknowledgment time, escalation time, and the percentage of issues handled within your defined SLA.
Prioritize Vulnerabilities by Real-World Risk (CISA KEV, CVSS, EPSS)
Do not work through vulnerability findings in the order they arrive. Prioritize vulnerabilities known to be exploited, then assess severity, exploitation likelihood, and the importance of affected systems.
- Known Exploited Vulnerabilities (KEV): The Cybersecurity and Infrastructure Security Agency (CISA) catalog identifies vulnerabilities known to have been exploited in the wild. Treat a matching finding as a front-of-the-queue signal.
- Common Vulnerability Scoring System (CVSS): A framework that scores a vulnerability’s technical severity on a 0 to 10 scale. Use it to understand potential impact, but do not treat the score alone as a complete risk assessment.
- Exploit Prediction Scoring System (EPSS): A data-driven estimate of the probability that a published CVE will be exploited in the wild within the next 30 days.
Combine these signals with exposure, business criticality, available mitigations, and your compliance obligations. For example, a vulnerability that is already being actively exploited on a public-facing app should take priority over a higher-scoring issue that only exists on an isolated test system. Monitor time to triage and time to verify remediation by risk category.
Eliminate Maintenance Window Dependencies
A patch released just after a monthly maintenance window may wait weeks for the next scheduled deployment. That delay increases vulnerability exposure even when the fix is ready. Replace one fixed maintenance window with tiered deployments that match risk and operational needs.
- For actively exploited vulnerabilities, use an emergency deployment path with fast testing and approval.
- Deploy standard patches during each endpoint’s local off-hours.
- Roll out low-risk updates continuously through staged policies.
For example, a distributed workforce should not have to wait for one regional maintenance window to receive a critical browser security update. Remote laptops should get patched on a schedule that matches when they are online.
Track the time from patch availability to deployment, the percentage of endpoints patched within the target, and the number of exceptions that require manual intervention.
Add Automated Rollback and Regression Testing
The fear of breaking a production application drives teams to require manual approval for every patch. Reduce that concern with staged rollouts and defined rollback criteria. Deploy in rings: a small test group first, then a pilot, then the full fleet. If a ring shows a failure rate above your threshold, say 5% failed installs, pause the rollout and investigate.
For high-risk applications and drivers, run regression tests to confirm that key functions still work after an update. If a release crosses an agreed failure threshold, stop the rollout and trigger a tested rollback or recovery procedure where the software supports it.
Not every patch can be safely reversed, so define alternatives before deployment. Measure rollout failure rates, time to detect a bad release, and time to restore the previous working state.
Automate Post-Deployment Verification and Compliance Reporting
Silent patch failures keep the MTTR clock running. Endpoints may be offline, installations may fail silently, or a restart may still be pending. Configure automated rescans or agent-based checks to confirm the installed version and verify that the vulnerability is eliminated. Keep remediation open when verification is incomplete.
Feed those results into a live compliance dashboard that shows patch coverage, MTTR by severity, overdue items, failed deployments, and SLA status. For example, if 98% of endpoints have received a critical patch, the dashboard should identify the remaining 2% and show whether they are offline, awaiting a restart, or reporting an installation error.
Automated reporting gives security and IT operations a shared view of remediation progress. Track verified coverage, time from deployment to verification, and the percentage of findings closed with supporting evidence.
Clarify Ownership and On-Call Readiness
Assign an owner to every application and endpoint group. Document who investigates findings, approves exceptions, deploys fixes, verifies results, and takes over when the primary owner is not available. Decide how handoffs work between shifts and teams. Connect ownership assignments to ticketing and alerting workflows so that critical findings land with an owner.
Run game days and practice drills using simulated failed deployments, urgent vulnerabilities, and unavailable application owners. These exercises familiarize responders with incident procedures and reveal flaws in escalation paths.
Track time to acknowledge, time to reach the correct responder, and the percentage of critical findings with an assigned owner.
Run Blameless Postmortems with Actionable Follow-Through
After a major software incident or missing patch SLA, hold a review to understand what happened and why the workflow did not prevent or resolve it sooner. Document the timeline, contributing factors, user or security impact, and actions needed to prevent a repeat.
Aim to complete the review within 24 to 48 hours while the evidence is still fresh. Assign each action a due date and track it to completion. Actions might include improving a monitoring rule, removing an unnecessary approval step, or updating a runbook.
Finally, check whether the change improved the next remediation cycle. Compare median and 90th-percentile MTTR, stage-level delays, and repeat incidents before and after the improvement.
Why Can the Last 5% of Failed Remediations Dominate MTTR?
At scale, MTTR is often decided by the small group of endpoints that don’t remediate on the first try, rather than by the majority that do. A remediation exception is an endpoint that fails to reach verified remediation on the first attempt.
Consider a monthly Windows cumulative update deployed to 10,000 endpoints. Most install within hours, but if 5% fail to remediate on the first attempt, 500 endpoints remain unresolved. This is an illustrative example, not an industry benchmark. Even when the majority of deployments succeed quickly, those 500 exceptions can keep remediation work open for days.
These failures aren’t hypothetical. Microsoft documents them as real Windows Update conditions involving installation blocked by an application or driver, a restart required to continue installation, update download failures, servicing corruption, policy conflicts, compatibility problems, and failed installations. Microsoft also notes that if a device “didn’t restart after a previous update, pending actions might still have to finish” before new updates can be applied.
A fleet-wide average can look healthy while those exceptions stay open for days. To understand where remediation gets stuck, track these operational metrics alongside MTTR:
- First-attempt remediation success rate: The percentage of endpoints successfully remediated on the first try.
- Exception rate: The percentage that fail to reach verified remediation on that attempt.
- Time to clear remediation exceptions: How long it takes to resolve those failures.
- Recurring failure reasons: The most common causes of unsuccessful remediation.
- 90th-percentile (P90) remediation time: How long remediation takes for 90% of cases, revealing the slower tail.
If the same failure reasons show up every cycle, investigate them. Where appropriate, turn them into repeatable remediation workflows or scripts, so your team isn’t repeating the same manual work every patch cycle.
Remember: Reducing MTTR at scale means reducing the time spent clearing remediation exceptions, not only making successful deployments faster.
Which Tools Help Reduce Software Remediation MTTR?
Tools can reduce MTTR by removing inefficiencies in the software remediation lifecycle, from detecting vulnerabilities to verifying fixes. Start with the software-remediation stack (patch management, vulnerability management, software deployment, and scripting and automation capabilities). Incident-management and observability tools support this stack by improving alert routing, investigation, and coordination.
The following can help as a buying checklist:
| Lifecycle stage | Capabilities that shorten it |
|---|---|
| Detect | Agent-based, continuous vulnerability assessment across office, remote and cloud endpoints |
| Prioritize and triage | KEV, CVSS and EPSS data in one view, plus exposure and SLA status |
| Test and approve | Policy-based approvals, update rings and automatic rollback |
| Deploy | Operating system and third-party patching, software install and removal, remote scripts, offline endpoint catch-up |
| Verify | Automated rescan, real-time status, SLA dashboards and audit-ready reports |
Patch and Vulnerability Management Platforms
When vulnerability scanning, assessment, patch deployment and remediation run on one platform, a finding maps straight to a fix, with no export, re-import, or ticket in between. This reduces manual handoffs and helps teams track remediation in one place.
When evaluating patch and vulnerability management platforms, look for:
- Operating system and third-party application patching
- Real-time or frequent vulnerability assessments with endpoint-level findings
- Policy-based automation with controls for high-risk changes
- Rollback or recovery options where supported
- Reporting for patch coverage, failed deployments, verified remediation, and MTTR by severity
Automation, Scripting, and Software Deployment Tools
Automation tools help teams handle routine remediation and resolve exceptions without repeating manual steps. Look for tools offering script libraries, reusable runbooks, and remote script execution at scale. These capabilities let teams automate tasks such as uninstalling a vulnerable application version, restarting a service after an update, or collecting diagnostic logs after a failed installation.
Software deployment features should support scheduled and policy-based rollouts, installation and uninstallation, deployment status, and retry handling. For higher-risk actions, require approval gates or staged deployment to prevent a faulty script or package from affecting the entire fleet.
Also check whether the tool records execution results, captures errors, and reports which endpoints succeeded or failed. This information helps teams target exceptions. Measure script success rates, time to complete deployment, and time to clear failed remediations.
Observability and Monitoring Platforms
Observability tools help detect software failures and investigate incidents by connecting alerts with application metrics, logs, and recent changes. If error rates rise immediately after a patch or software deployment, teams can investigate the change sooner and decide whether to pause the rollout or roll back the release. Look for change tracking, alert correlation, anomaly detection, and links to deployment records.
What is Your Vulnerability Remediation Maturity Level?
Your vulnerability remediation maturity depends on how reliably you discover, prioritize, deploy, and verify fixes across your software estate. A team that relies on spreadsheets and manual patching faces different bottlenecks from one that automates routine updates or verifies remediation continuously.
The following three-stage model is adapted from the maturity framework given by Automox. The MTTR and FTE figures are indicative benchmarks, not universal industry averages. Your results depend on fleet complexity, application diversity, risk requirements, and the amount of manual work involved.
| Stage | How you discover | How you deploy | How you verify | Typical critical MTTR | Coverage | FTE per endpoints* |
|---|---|---|---|---|---|---|
| 1: Manual | Periodic scans (monthly or quarterly) and spreadsheets | Manual approvals and scheduled patching, ticket by ticket | Manual spot checks and reports | 60 to 120+ days | Known endpoints only | 1 per 500 |
| 2: Semi-automated | Weekly or daily scan and centralized findings, ranked by KEV | Automated policies for operating system patches, manual for the rest, risk-based prioritization | Rescan within 48 hours for deployment status and follow-up checks | 14 to 30 days | Most managed endpoints | 1 per 2,000 |
| 3: Fully automated | Continuous scanning with real-time, risk-based alerts | Policy-driven deployment without routine maintenance-window gating; staged rollout and rollback controls | Automated rescan within one hour, with verification and compliance reporting | Under 7 days | 95%+ coverage, including remote, BYOD, and short-lived endpoints | 1 per 5,000+ |
Source: Automox maturity model, rewritten. Automox does not publish the data behind these figures, so treat them as directional.
*FTE means full-time equivalent. These figures are planning estimates from the maturity model, not staffing standards.
Three-question self-assessment: Score each answer 1, 2 or 3, then see which stage your answers point to.
- How often does a scan tell you what is vulnerable?
| Monthly or less (1) |
|---|
| Weekly or daily (2) |
| Continuously with real-time alerts (3) |
- Who approves and deploys a routine patch?
| A person, patch by patch (1) |
|---|
| An automated policy for operating system patches only (2) |
| Automated policies with rings and rollback for supported patches (3) |
- How do you know the fix worked?
| A closed ticket or a “deployed” status (1) |
|---|
| A rescan within 48 hours (2) |
| An automated rescan within an hour (3) |
Scoring guide: treat these as indicative stages.
- 3–4 points: Stage 1, Manual
- 5–7 points: Stage 2, Semi-automated
- 8–9 points: Stage 3, Fully automated
Stage 1 to Stage 2: Replace Manual Steps with Automation
Start by removing repetitive tasks that delay routine remediation. Schedule daily vulnerability scans, configure automated operating system patch policies, and use the KEV catalog to prioritize known exploited vulnerabilities.
Centralize deployment status so your team can identify failed installations and endpoints that need attention. Keep manual review for high-risk changes, but avoid individual approvals for routine patches.
The maturity model associates this transition with a potential reduction in critical vulnerability MTTR from 60–120+ days to 14–30 days, while the illustrative staffing ratio shifts from one full-time equivalent per 500 endpoints to one per 2,000. Treat these as targets to evaluate against your own baseline.
Stage 2 to Stage 3: Continuous, Self-Verifying Remediation
The next step is to connect deployment, recovery, and verification into one workflow. Remove routine maintenance-window dependencies where possible. Use staged deployments, automated health checks, and rollback or recovery procedures to limit the impact of failed updates.
After deployment, automatically verify that the patch is active and the vulnerability is eliminated. Feed results into compliance reports that show patch coverage, overdue findings, and MTTR by severity. Keep exceptions open until remediation is verified or formally handled under your risk-acceptance process.
The model places highly automated teams at under seven days for critical vulnerability MTTR, with 95% or higher patch coverage and approximately one full-time equivalent per 5,000 or more endpoints. Remember that these are aspirational planning targets.
Where to Start This Week
Use this checklist to identify improvements for your current remediation maturity stage.
Stage 1: Quick wins
- Create an inventory of managed endpoints and installed software.
- Schedule daily vulnerability scans and record findings centrally.
- Assign owners and deadlines to critical vulnerabilities, prioritizing known exploited issues.
- Record start and stop timestamps for your next five critical vulnerabilities, then calculate the median.
Stage 2: Quick wins
- Create automated patch policies for routine operating system and third-party updates.
- Configure alerts for failed deployments, pending restarts, and endpoints that stop reporting.
- Automate post-deployment verification and report exceptions separately from successful patches.
Stage 3: Quick wins
- Set up update rings and a failure threshold that halts a rollout and triggers rollback where supported or initiates a tested recovery procedure.
- Replace one fixed maintenance window with tiers: exploited CVEs deploy immediately, the rest in local off-hours.
- Add an automatic rescan after every deployment.
- Build a live dashboard showing verified patch coverage, median and 90th-percentile MTTR, and overdue critical findings.
MTTR Troubleshooting Checklist: Who, What, When
Use this checklist to identify gaps in your patching, vulnerability remediation, and software incident workflows.
Who owns remediation?
☐ Is there a named remediation owner for each application and endpoint group?
☐ Is there a designated person or team that investigates findings, approves changes, deploys fixes, and verifies remediation?
☐ Do they know who to escalate to, and when?
What happens when an issue occurs?
☐ Is the severity set, and linked to a playbook with response steps, approval rules, and escalation targets?
☐ Will the incident or missed SLA be documented within 24 to 48 hours?
☐ Will deployment failures, diagnostic findings, rollback decisions, and verification results be recorded in a shared ticket or system?
When do you measure progress?
☐ Are timestamps captured at each stage: detection, triage, approval, deployment, and verified remediation?
☐ Is the MTTR review performed every quarter? Does it cover median and 90th-percentile MTTR by severity and application?
☐ Are recurring delays identified and specific actions taken to address them?
Frequently Asked Questions About Reducing MTTR
What is the Difference Between Vulnerability Management and Patch Management in the Context of MTTR?
Vulnerability management identifies, assesses, and prioritizes security risks. Patch management handles the deployment of software updates that address those risks. MTTR can span both processes, from detection to verified remediation. That’s why splitting them across separate tools inflates it: every export, ticket and handoff between the two adds time that neither team owns.
Can You Achieve Real-Time Vulnerability Remediation?
Near-real-time remediation is possible for routine patches that support automated deployment and verification. The agent detects, the policy approves, and the deployment runs within hours. However, testing, compatibility requirements, and rollout safeguards can consume time. Zero-day vulnerabilities without a patch are different. Until a fix ships, you need temporary mitigations, such as configuration changes, scripts, or isolating affected systems.
Is MTTR a Misleading Metric?
The r/sre debate has a point on both sides. Critics say a mean hides outliers and is easy to game by changing how teams define or record incidents. Defenders say it’s easy to start with and useful when broken into stages. Our position: track MTTR by severity, report the median and P90, and break it into MTTD, triage, deployment, and verification time.
How Action1 Helps Reduce MTTR From Vulnerability Detection to Verified Remediation
Action1 is a cloud-native autonomous endpoint management platform that helps you reduce mean time to remediate (MTTR) by shortening the path from discovering a vulnerability or software issue to remediating it and confirming that the fix reached the affected devices. It connects the remediation process from start to end: one platform for vulnerability assessment, risk-based prioritization, patching, software deployment, and remediation.
Once you install the agent and configure your policies, Action1 can continuously identify vulnerabilities, help you decide which issues need attention first, and automate supported remediation actions. When a patch is unavailable or unsuitable, you can document compensating controls centrally while using other appropriate remediation methods.
The following capabilities address delays that can keep vulnerabilities and software issues unresolved in your environment.
- 5-minute setup: Create an account, install the Action1 agent, and start managing patches in as little as five minutes. Because Action1 is cloud-native and agent-based, you do not need VPN-dependent patching, on-premises patch servers, and dedicated cache appliances. That means less infrastructure to configure before remediation can begin.
- Real-time endpoint visibility: View managed office and remote endpoints, servers, virtual machines, and cloud workloads from one console. Review installed applications and versions, operating system information, configuration data, and other endpoint details to identify which systems are affected without manually reconciling separate inventories.
- Real-time vulnerability identification: Action1 automatically assesses operating system and application vulnerabilities on managed Windows and macOS endpoints. Findings include CVE identifiers, CVSS scores, KEV status, and ransomware-related intelligence where available. This gives your team useful context for triage. See vulnerability assessment details.
- Vulnerability intelligence from multiple sources: Action1 combines vulnerability intelligence from sources including VulnCheck NVD++, the National Vulnerability Database (NVD), CISA KEV, Microsoft Security Response Center (MSRC), and vendor release notes. Broader context helps you assess exposure instead of relying on a severity score alone.
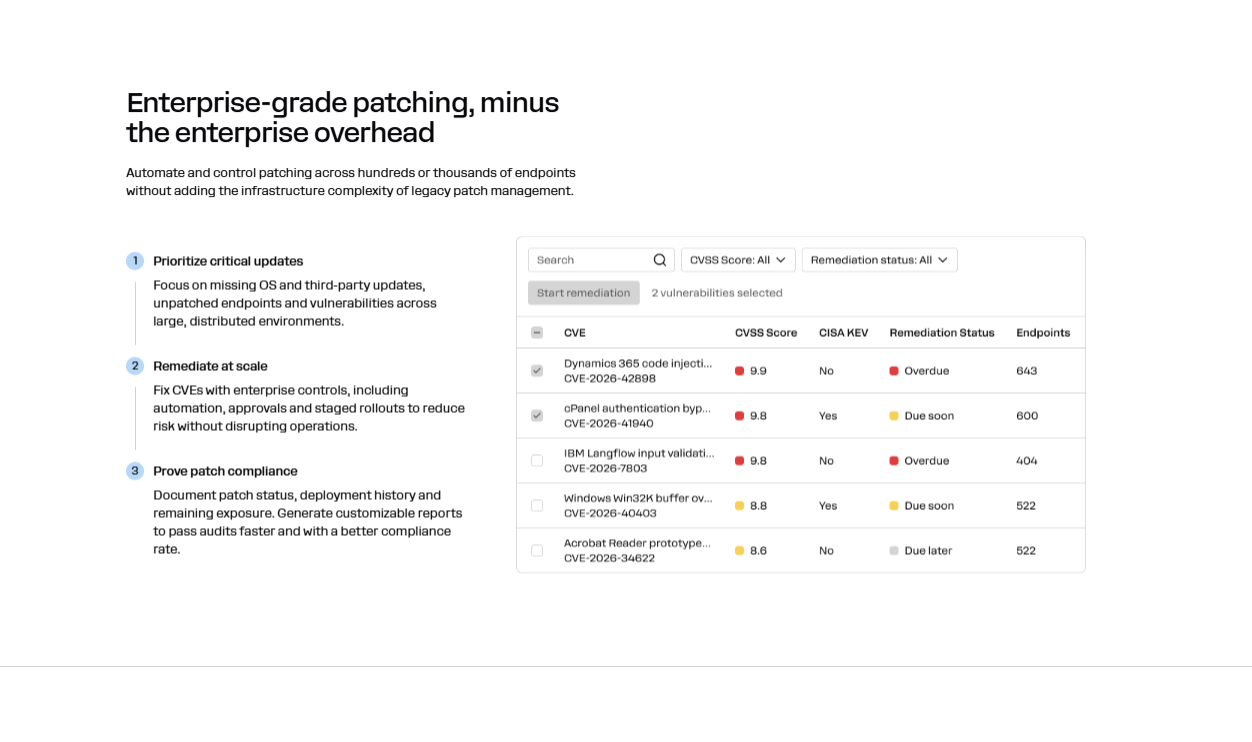
- Risk-informed prioritization: Use severity, known exploitation, ransomware associations, affected endpoints, and SLA deadlines to decide which findings need attention first. These indicators help your team make informed prioritization decisions.
- Built-in vulnerability remediation: Move from identifying a vulnerable endpoint to remediation within the same platform. Deploy a patch when one is available. When patching is not possible or appropriate, you can remove unsupported or legacy software. For vulnerabilities that cannot be patched, document compensating controls centrally. This helps your team track unresolved exposure and shows how it is being managed. Explore vulnerability management.
- Autonomous OS and third-party patching: Automate operating system patching for Windows, macOS, and Linux, along with supported third-party application patching on Windows and macOS. Policy-based deployment reduces the time between identifying a patchable vulnerability and distributing the fix to affected endpoints.
- Autonomous Update Rings: Roll patches out through deployment rings, starting with a smaller group and expanding as results meet configured success criteria. Once you set up the automation and schedule maintenance windows, Action1 automatically starts, manages, and completes the patching process. For emergency patches, you can trigger an existing automation, and Action1 handles the deployment process. A staged deployment lets you catch problematic updates before broad deployment while allowing qualified updates to advance without manual handoffs.
- Regular maintenance windows and emergency deployment: Schedule routine patching around maintenance windows, including schedules based on the endpoint’s local time. For urgent vulnerabilities, use immediate deployment rather than waiting for the next routine cycle, subject to your testing and change-control requirements. This is especially useful for reducing MTTR when a known exploited vulnerability needs faster action or poses too great a risk to wait.
- Automatic, delayed, and manual patch approvals: Configure automatic approval for routine updates, delay deployment to allow additional validation, or require manual approval for critical systems. MSPs and organizations with separate business units can also maintain distinct policies, approval processes, and schedules through multi-tenant management.
- Privately maintained software repository: Action1 maintains a secure third-party software repository, with 99% coverage for typical enterprise environments. It does not rely on community-maintained repositories such as Chocolatey or Winget. Curated, tested packages help standardize deployment, enabling controlled and efficient third-party remediation.
- Scripting for remediation and edge cases: Run custom PowerShell, CMD, or Bash scripts, or use scripts from the Action1 Script Library. Execute scripts immediately or schedule them for later, including configured handling of missed tasks on offline endpoints. Scripts can address problems that a standard patch cannot solve, such as restarting a service, changing a configuration, or collecting diagnostic logs.
- Software deployment and vulnerable software removal: Deploy prepackaged applications or custom software, and bulk-remove unauthorized, unsupported, legacy, or vulnerable applications from endpoint groups. Depending on the available controls, target a specific version, all versions, or versions below a defined release. Removing a vulnerable application may be the fastest and safest remediation option when no suitable update is available.
- Offline endpoint catch-up: If an endpoint is offline when a scheduled patch, script, or deployment is due, Action1 can resume missed work once the device reconnects, according to the configured execution deadline. This helps prevent remote and intermittently connected devices from becoming a long tail of unresolved remediation.
- Peer-to-peer (P2P) patch distribution: Action1 uses P2P distribution, especially when patching hundreds or thousands of endpoints. When one endpoint downloads update content, it shares that content with other endpoints on the same local network, so they don’t have to download it separately from the internet. This reduces repeated external downloads and bandwidth use without requiring dedicated cache servers or local distribution appliances.
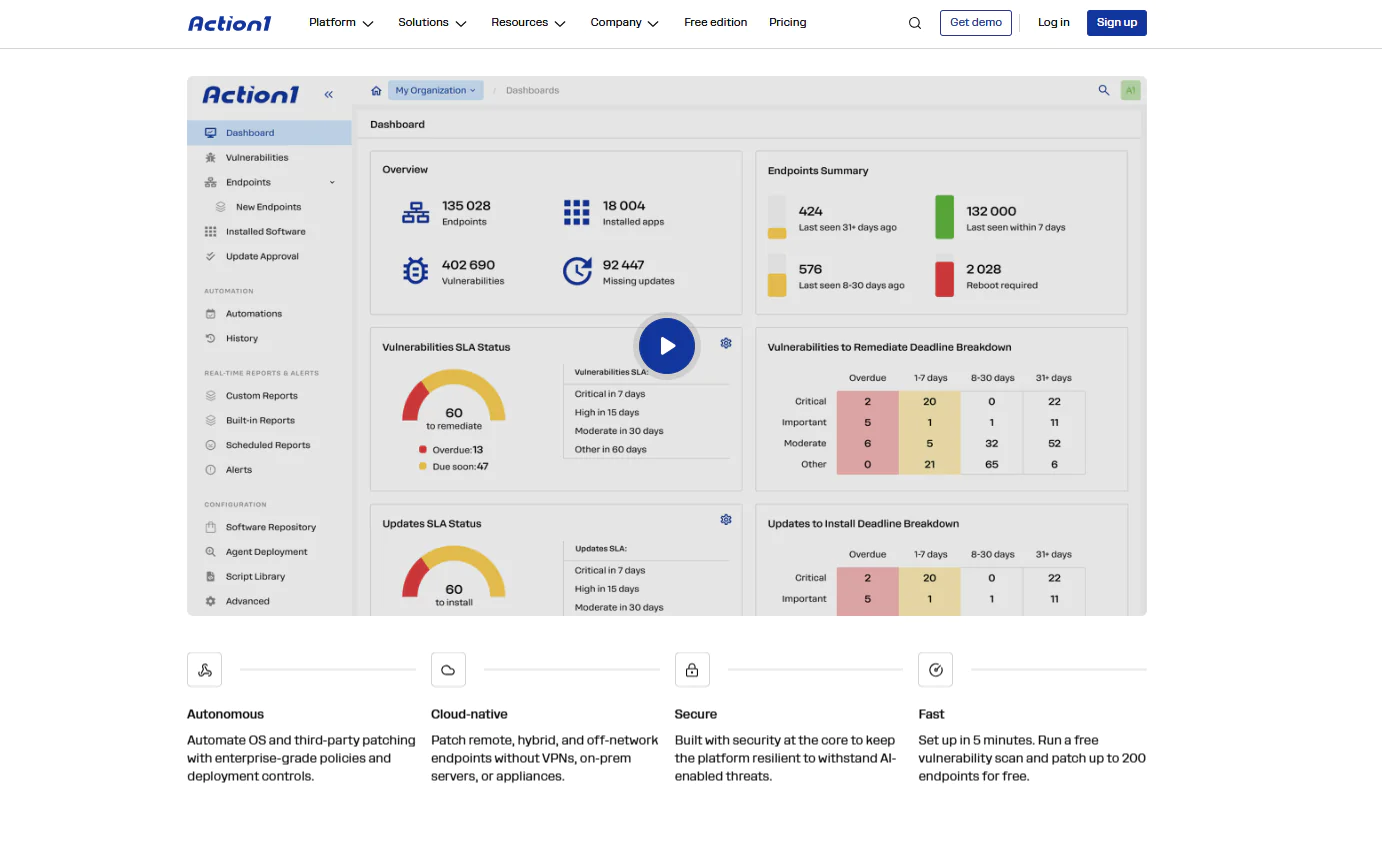
- Remediation verification and SLA tracking: MTTR should stop when remediation is verified, not when a patch is deployed. Action1 provides real-time deployment progress and SLA-based dashboards for patch compliance and active vulnerabilities, helping teams identify successful updates, remaining exposure, and endpoints that still need attention. Use these results to guide follow-up work and confirm remediation status.
- 100+ built-in and customizable reports: Use 100+ built-in reports covering patching, vulnerability findings, software and hardware inventory, security configuration, and other endpoint data. You can customize existing reports, change filters and grouping, drill into results, build reports from PowerShell output, export to CSV, and subscribe by email. These reports support remediation verification, SLA monitoring, operational reviews, and audit preparation.
- Browser-based access: Manage, update, and remotely access supported endpoints through a browser from anywhere with an internet connection. Because endpoint management does not depend on a corporate VPN, IT teams can work with distributed endpoints without first connecting them to the office network.
- Scalability across large endpoint fleets: Action1 is designed to scale from hundreds to hundreds of thousands of endpoints without requiring additional on-premises management infrastructure. Centralized policies, automation, and reporting prevent remediation from becoming a slow, machine-by-machine process as your environment grows.
- Free tier for up to 200 endpoints: Action1 offers its full feature set for the first 200 endpoints at no cost, with no expiration date. You can use the free tier to evaluate the platform in a test lab or manage a small environment before deciding whether to expand.
The takeaway: Action1 helps reduce MTTR by connecting vulnerability identification, prioritization, approvals, deployment, remediation, offline endpoint catch-up, and verification in one cloud-native workflow. It automates time-consuming steps in the remediation lifecycle, helping teams resolve issues faster across large endpoint environments.
Ready to see your own MTTR improve? Start free with up to 200 endpoints or request a demo and see how Action1 helps your team resolve vulnerabilities faster across a distributed endpoint environment.