


TL; DR
- What is MTBF: MTBF (Mean Time Between Failures) is the average operating time between unplanned failures in a repairable system (like an endpoint, server, or application). Higher is better.
- Key Rule: Only unplanned events count (crashes, BSODs, failed updates). Planned maintenance reboots and user-initiated restarts do not count as failures.
- The Formula: MTBF = Total operating time ÷ Number of failures. Use operating hours (excluding powered-off time), not calendar hours.
- IT vs. Hardware: Unlike hardware (which wears out), software doesn’t physically degrade. MTBF for software measures change quality and patch hygiene, not physical wear.
- The Bigger Picture: MTBF measures how often failures happen (reliability). MTTR measures how fast you recover. Combined, they determine availability (e.g., 99.9% uptime).
- How to Improve It: Use root-cause analysis, predictable patch schedules, deployment rings to catch bad updates early, and automated remediation scripts.
MTBF stands for mean time between failures. It is the average time a repairable system runs between unplanned failures, and it gives you a number for system reliability. Higher is better.
Many guides explain the time between failures with motors, pumps and production lines. This one doesn’t. Here, the system is an endpoint, server, operating system, application, or service. You’ll learn how to calculate MTBF from Windows event logs, how it compares with MTTR (mean time to remediate), MTTF (mean time to failure) and MTTA (mean time to acknowledge).
MTBF helps you assess system reliability, identify recurring problems, evaluate whether software changes improve stability, and make better decisions about patching, maintenance windows, and software quality.
Ready to see your own MTBF improve? Start free with up to 200 endpoints or request a demo to see how Action1 can help your team reduce preventable failures and improve endpoint reliability.
What is MTBF and What Does Mean Time Between Failures Measure?
MTBF is the average operating time between one unplanned failure and the next in a repairable system. In IT, that system can be a laptop, a server, a service or an application. It helps teams measure reliability by comparing total operating time with the number of failures recorded during that period.
This MTBF definition comes with three facts:
- It applies to repairable systems. An endpoint that restarts after a crash or recovers after a failed update can return to service. Its operating time between failures can be measured over repeated incidents. Items you replace rather than repair do not qualify under MTBF. They use a metric called MTTF.
- It is an average, not a guarantee. A file server with an MTBF of 240 hours can fail twice in its first week and then run for three months without another incident.
- A high MTBF means failures are less likely, not impossible. It indicates that failures occur less frequently relative to operating time. Plan for the next one anyway.
If you’re asking what does MTBF mean in practice, the answer is it measures failure frequency, not severity. It treats every failure the same. A crashed print spooler on an endpoint and a crashed domain controller each count as one failure, even though their operational impact differs substantially. Averages hide that difference, so track your most important servers separately (more on that under MTBCF).
Use MTBF with downtime, mean time to remediate (MTTR), and availability to understand how often failures occur and how much they disrupt your organization.
What Counts as a Failure When Calculating MTBF for Software?
MTBF depends on how you define failure. For software systems, a failure is an unplanned event that prevents an endpoint, server, application, or service from performing its required function. Planned maintenance is not a failure. Keep planned downtime separate from failure-related downtime.
Document your definition of a failure before you calculate MTBF. Two teams using different rules will get numbers that can’t be compared.
Count these as failures:
- Unexpected shutdowns and blue screens (BSODs)
- Application crashes and hangs
- Services that stop unexpectedly
- Failed updates that force a rollback
- Security incidents that take a system or service out of operation
Don’t count these:
- Planned patch reboots inside a maintenance window
- Restarts and shutdowns that a user or admin starts on purpose
- Scheduled service restarts and planned OS upgrades
- Hours when the device is powered off
One catch: if a planned patch reboot hangs or ends in a blue screen, that outcome is a failure even though the reboot was planned. Count it.
Your MTBF measurement policy should include:
- System scope: Specify the endpoint, server, application, or service being measured.
- Failure criteria: List the events that qualify as failures.
- Exclusions: Identify planned maintenance and other events outside the measurement scope.
- Incident grouping: Combine related alerts and duplicate events into one incident rather than counting each log entry separately.
- Observation period: Set a start and end date.
- Operating-time unit: Decide whether to measure operating time in hours or another unit. Hours is the usual choice.
Apply the same rules whenever you calculate or compare MTBF. Change the rules and you’ve changed the baseline.
MTBF for Hardware vs. Software: Why Software Fails Differently
Hardware failures rates are often modeled using the bathtub curve. They start high during early failures, followed by a long flat useful life period, then rise as components wear out. The model comes from manufacturing, and it fits physical equipment such as drives and batteries.
Unlike hardware, software doesn’t physically wear out. However, its failure rate can change as conditions change. A new release, cumulative update, driver update, or configuration change may introduce defects or trigger existing ones. Failures can also occur without any recent changes, when specific workloads, operating conditions, or resource constraints expose latent defects. As a result, software failure rates may rise after changes, fluctuate under different conditions, or remain stable over time. The pattern depends on the software and its operating environment, rather than following a single predictable curve.
This makes MTBF a useful measure of change quality and patch hygiene for IT teams. A sudden drop tells you a change went wrong. A steady climb tells you your process is working.
MTBF vs. MTTR, MTTF, MTTA, and Failure Rate
MTBF is one of several reliability metrics. Others include MTTR, MTTF, MTTA, and failure rate. The table compares them to help you choose the right one for measuring different aspects of software and endpoint reliability.
| Metric | What it measures | Applies to | IT example | Better is |
|---|---|---|---|---|
| MTBF (mean time between failures) | Average operating time between unplanned failures | Repairable systems | 4,000 hours between unexpected shutdowns on a typical laptop | Higher |
| MTTR (mean time to remediate) | Average time to fix, patch, or resolve a security vulnerability or incident from the moment it is discovered until the fix is verified. | Repairable (software) systems | 2 hours to rebuild a crashed server role | Lower |
| MTTF (mean time to failure) | Average operating time until a non-repairable item fails | Non-replaceable items | An SSD or laptop battery in service until it dies | Higher |
| MTTA (mean time to acknowledge) | Average time from alert to a person acknowledging it | Alerting and on-call process, incident response | 6 minutes from a server alert to an engineer picking it up | Lower |
| Failure rate | Failures per hour of operation (1 ÷ MTBF) | Systems with measurable failure events | Four failures per 1,000 operating hours | Lower |
MTBF vs. MTTR (Mean Time to Remediate)
MTBF measures how frequent failures occur relative to operating time. MTTR measures the average time required to fix, patch, or resolve a security vulnerability or incident from the moment it is discovered until the fix is verified. Together they decide how much downtime your users feel. A high MTBF and a low MTTR generally indicate a more reliable, recoverable system.
Don’t confuse MTTR with mean down time (MDT). MDT measures the average time a system remains unavailable, including administrative and logistical delays. MTTR focuses on the time required to repair a failure, but what counts toward that time depends on the measurement methodology. It may include diagnosis, testing, and verification, not just hands-on repair work.
MTBF vs. MTTF (Mean Time to Failure)
MTTF is for non-repairable items that you replace instead of fix. It measures the average operating time until a non-repairable item fails. An SSD or a laptop battery qualifies. An operating system or an application almost never does, because you restart it, patch it, or reinstall it and it carries on. That’s why MTBF, not MTTF, is the right metric for software.
Failure Rate: The Inverse of MTBF
Failure rate (λ) expresses how frequently failures occur per unit of operating time. It is the inverse of MTBF.
λ = 1 ÷ MTBF
Suppose a system has 4 failures in 1,000 hours.
Failure rate: 4 ÷ 1,000 = 0.004 failures per hour
MTBF: 1,000 ÷ 4 = 250 hours
Because this model assumes a constant failure rate, failures follow an exponential distribution. Under this model, the probability of a system reaching its MTBF without breaking down is e-1≈36.8%. This happens because a small number of long-surviving systems drag the average (MTBF) upward. As a result, a typical system fails before reaching the average MTBF mark.
MTTA (Mean Time to Acknowledge)
MTTA measures the average time from an alert being fired to a person acknowledging it. It helps you assess how quickly your team recognizes incidents and begins responding. A delayed acknowledgment can extend downtime and increase MTTR when the measurement includes the time from incident detection to service restoration. If MTTR measures only the repair phase, the acknowledgment delay falls outside that calculation. MTBF measures the operating time between failures, regardless of how quickly someone responds to them.
Variations of MTBF (MTBCF, MTBSA, MTBUR)
Mean time between critical failures (MTBCF) measures the average operating time between failures that stop a business-critical function. It addresses a key limitation of MTBF: not all failures have the same business impact. Track MTBCF for domain controllers, database servers, and line-of-business apps separately from fleet-wide MTBF. Two hardware-era variants, mean time between system aborts (MTBSA) and mean time between unscheduled removals (MTBUR), rarely matter in IT.
How to Calculate MTBF?
To calculate MTBF, start with the following steps:
- Define the system: an endpoint, a server role or an app.
- Define which events count as failures, as discussed in the What Counts as a Failure When Calculating MTBF for Software section.
- Set the observation window, such as 30 days.
- Collect powered-on hours and the number of failures for that window.
For endpoints and servers, use operating hours rather than calendar hours when devices spend time powered off.
Now we are ready for MTBF calculation. The following sections explain how to calculate mean time between failures using a formula, practical examples, and Windows event data.
MTBF Formula
The formula for calculating MTBF is:
MTBF = Total operating time ÷ Number of failures
Use total operating time (in hours), not total time, and divide it by the number of qualifying failures recorded during the same observation period. The result is MTBF in hours. For laptops and virtual desktops, powered-off hours must be excluded. If a laptop sits in a bag for 500 of its 720 hours, its operating time is 220 hours, not 720. Using calendar time instead of actual operating time can make systems appear more reliable than they are.
You can also calculate MTBF from a known, constant failure rate:
MTBF = 1 ÷ failure rate
Same answer, different starting point.
MTBF Calculation Example
Suppose a file server operates for 720 hours during a 30-day observation period and experiences three unexpected shutdowns. To calculate MTBF, divide its total operating time by the number of failures.
| Operating hours | 720 |
|---|---|
| Shutdowns / Failures | 3 |
| MTBF | 720 ÷ 3 = 240 hours |
On average, this server runs for 240 hours or 10 days between failures. It does not mean that the next shutdown will occur after exactly 10 days.
Fleet MTBF vs. Per-Endpoint MTBF
You can report MTBF for one typical endpoint or for the fleet as a whole, and the two numbers answer different questions.
Say you manage 200 endpoints over a 30-day month of 720 hours. Total operating time is 200 × 720 = 144,000 endpoint-hours, and the fleet logs 36 unexpected shutdowns.
| Measure | Calculation | Result | Use it for |
|---|---|---|---|
| MTBF per endpoint, averaged across the fleet | 144,000 ÷ 36 failures | 4,000 hours (about 5.5 months between failures for a typical device) | Assessing endpoint reliability and planning |
| Fleet-wide failure interval | 4,000 ÷ 200 (or 720 ÷ 36) | 20 hours | Understanding how often your service desk may receive tickets and staffing accordingly |
A typical device goes about 5.5 months between failures. But with 200 devices, your service desk sees a failure somewhere in the fleet every 20 hours. Don’t take that 20-hour figure and call it MTBF per endpoint. It tells you how often the fleet fails, not how long one device lasts. Use both numbers.
Pulling Failure Data from Windows Event Logs with PowerShell
Windows event logs provide a starting point for measuring unexpected failures. The relevant event IDs include:
- 6008 (System log, EventLog): the previous shutdown was unexpected
- 41 (System log, Microsoft-Windows-Kernel-Power): the system restarted without a clean shutdown
- 1001 (System log, Microsoft-Windows-WER-SystemErrorReporting): Windows recorded a bug check, commonly associated with a blue screen
- 1000 and 1002 (Application log, Application Error and Application Hang, respectively): an application crashed or stopped responding
- 7031 and 7034 (System log, Service Control Manager): a service stopped unexpectedly
Event IDs aren’t always unique across Windows event sources, so filter by both the ID and the source. These events can help identify failures, but they don’t necessarily establish when an incident began or when service was restored.
Events 41 and 6008 usually fire for the same incident. Counting both as separate failures can inflate the failure count and lower MTBF incorrectly. Count one of them (say 6008), or group events into incidents (for example, anything within ten minutes counts as one). Or correlate timestamps and event details to group related records into individual incidents.
If you’d rather skip code, Windows Reliability Monitor (perfmon /rel) provides a timeline of reliability-related events for a single device, including application crashes and system failures. It offers a summary, but it doesn’t display every Windows Event Log record or provides all the details needed for a custom MTBF calculation. For more precise measurements, use Event Viewer or PowerShell to collect and analyze the relevant events.
The following PowerShell example counts Event ID 6008 entries from the past 30 days and calculates MTBF for an always-on endpoint it runs on. It assumes 720 operating hours and that the event log retains all relevant events.
# Approximate MTBF for unexpected shutdowns (Event ID 6008)
# Scope: System log entries from the past 30 days.
# Assumption: 24 hours of operation per day; downtime is not subtracted.

$days = 30
$start = (Get-Date).AddDays(-$days)
$assumedOperatingHours = $days * 24

try {
    $events = @(
        Get-WinEvent -FilterHashtable @{
            LogName   = 'System'
            Id        = 6008
            StartTime = $start
        } -ErrorAction Stop
    )

    $failures = $events.Count
    $status = if ($failures -gt 0) {
        'Events collected'
    } else {
        'No unexpected shutdowns found'
    }

    $mtbf = if ($failures -gt 0) {
        [math]::Round($assumedOperatingHours / $failures, 2)
    } else {
        'Not calculable: no failures found'
    }
}
catch {
    if ($_.FullyQualifiedErrorId -like 'NoMatchingEventsFound*') {
        $failures = 0
        $status = 'No unexpected shutdowns found'
        $mtbf = 'Not calculable: no failures found'
    }
    else {
        $failures = $null
        $status = "Unable to read event log: $($_.Exception.Message)"
        $mtbf = 'Not calculated'
    }
}

[pscustomobject]@{
    Computer                  = $env:COMPUTERNAME
    PeriodDays                = $days
    AssumedOperatingHours     = $assumedOperatingHours
    Failures                  = $failures
    ApproximateMTBF_Hours     = $mtbf
    Status                    = $status
}
Important limitations: This example counts only Event ID 6008 entries in the System log. It doesn’t measure application crashes, service failures, or overall endpoint reliability. The 720-hour figure assumes continuous operation and doesn’t subtract downtime, so the result is an approximation, not a measurement of actual operating-time MTBF. For greater accuracy, use recorded operating hours and account for downtime.
To collect results for a fleet, add the script to Action1’s script library and run it against all endpoints or a selected group. It collects each endpoint’s failure count and operating hours, and aggregates the results. Calculate fleet MTBF by dividing combined operating hours by the combined qualifying failure count, rather than averaging endpoint MTBF values. An endpoint with zero failures has no MTBF, so averaging would throw its hours away. You can also build a custom Action1 report from the script’s output.
Calculating MTBF for Redundant Systems (Series vs. Parallel)
Services rarely depend on a single component, and system architecture affects how component failures influence service reliability.
In a series configuration, every component has to work, so either failure takes the service down. For example, an application server that depends on a database can become unavailable if either component fails. Assuming independent failures and constant failure rates, calculate combined MTBF as:
1 ÷ (1/MTBF₁ + 1/MTBF₂)
With two components at 1,000 hours each:
Combined MTBF = 1 ÷ (0.001 + 0.001) = 500 hours
In a parallel configuration, redundant components can keep a service running when one component fails. A load-balanced pair of web servers can improve service availability, provided that the remaining server can handle the workload and failover works as intended. However, shared dependencies, such as a common database, or configuration problems affecting both servers can still cause an outage.
The lesson: count your dependencies and add redundancy where an outage costs the most.
Accounting for Systems That Haven’t Failed Yet (Censoring)
Some endpoints operate throughout the observation period without experiencing a qualifying failure. Include their observed operating hours in the total operating time, even though they contribute zero failures. If you calculate MTBF using only devices that have failed, you exclude successful operating time and can underestimate reliability.
Why Should IT Teams Track MTBF?
MTBF can help identify recurring failures, assess the impact of software changes, and guide better decisions about maintenance and IT spending.
Reduce unplanned outages and support tickets
A declining MTBF can signal that endpoints, servers, and applications are failing more frequently. Investigating these patterns helps you address recurring causes, limit unplanned downtime, and reduce support tickets.
Evaluate patch and change policies
Compare MTBF before and after a change to your patching cadence, deployment process, or configuration policy. If failures become more frequent after an update, investigate and reevaluate the change. If MTBF improves, the results provide evidence that your changes may be improving reliability.
Make smarter refresh and budget decisions
Break down MTBF by device model, operating system build, or application version to identify systems with low MTBF, as it indicates poor reliability. Combine these findings with repair costs, support effort, and downtime data to decide whether to update software, replace aging devices, or allocate budget elsewhere.
Support credible SLAs
MTBF can inform availability calculations, and availability drives the uptime figure in your SLA. Pair it with MTTR and you can show whether a 99.9% target is realistic for a service. However, actual availability also depends on how downtime is measured and whether redundant systems keep services running during individual component failures.
Where IT Teams Use MTBF
MTBF started in aerospace, medical devices and industrial production, where a failure can halt a line or put people at risk. IT teams borrowed it for the same reason: you can’t improve what you can’t measure. Today it earns its place in four areas:
| Area | Common MTBF Uses |
|---|---|
| Endpoint fleets: laptops, desktops and virtual desktops | Compare reliability for device models, operating system builds, and application versions. |
| Server infrastructure: physical, virtual and cloud workloads | Identify recurring outages and evaluate the reliability of critical services. |
| Line-of-business applications | Assess whether releases introduce more failures. |
| Cloud services | Track service interruptions and evaluate changes to infrastructure or deployment practices. |
In each one, the method is the same. Define failure, count operating hours, divide, and compare against your own baseline instead of an industry number. It works for a single application or an entire data center.
Endpoint and Server Fleets
Track MTBF by device model, operating system build, and major application version to identify patterns that fleet-wide averages can hide. For example, if MTBF drops sharply on endpoints running a particular Windows build after a cumulative update, dig into the failures before expanding that deployment ring. This can limit the impact and prevent a localized issue from affecting more devices.
How to Improve MTBF
To improve MTBF, start with understanding why systems fail and make changes that prevent those failures from recurring. You can use incident data, controlled patching, automation, and continuous monitoring to improve software reliability for endpoints and servers.
Five levers do most of the work. Each one targets a type of failure and comes with a metric you can watch.
Find and Fix Root Causes
MTBF measures failure frequency but doesn’t tell you why those failures occur. Root-cause analysis does that and helps you prevent repeat incidents. Group failures by Windows Event ID, driver version, KB number, or application version. Look for patterns, investigate the most common cause, and apply a fix. For example, your analysis shows that 60% of blue screens (Event ID 1001) trace to one storage driver version. You update or roll back that driver on the affected models, then watch MTBF for those models over the next 30 days. The metric to watch is failures per cause, per week.
Patch on a Predictable Schedule
Emergency patches and surprise reboots create their own failures. A predictable patching cadence, on the other hand, helps you plan software changes, test updates, and schedule reboots during approved maintenance windows. Align deployments with Microsoft’s Patch Tuesday release cycle.
Treat this as preventive maintenance for software: patch on a schedule instead of reacting after something breaks. Planned patch installations and reboots within approved maintenance windows do not count as unplanned failures under your MTBF policy. However, an unexpected crash or failed update outside the planned activity still qualifies if it meets your failure criteria.
This approach reduces exposure to known bugs and vulnerabilities. Track MTBF, patch compliance, update-related incidents, and rollback rates before and after changes to your patching schedule to confirm whether the cadence is improving reliability.
Test Updates in Deployment Rings Before Broad Rollout
Deploy updates to a small pilot ring of IT staff and volunteers, then expand to broader endpoint groups, and finally to critical systems. Pause automatically if the pilot ring’s failure count rises. This limits the impact of regression failures by giving you time to detect problems before they affect the entire organization.
Take a 200-endpoint fleet that normally logs about 8 failures a week. Assume a bad update causes roughly 0.3 extra failures per endpoint in its first week. These figures are illustrative.
| Rollout | Endpoints hit | Failures in week | MTBF per endpoint (33,600 endpoint-hours) |
|---|---|---|---|
| Normal week, no bad update | 0 | about 8 | about 4,000 hours |
| Update to all 200 at once | 200 | 8 + 60 = 68 | 33,600 ÷ 68 = 494 hours |
| Pilot ring of 10, then paused | 10 | 8 + 3 = 11 | 33,600 ÷ 11 = about 3,050 hours |
The same bad update drops MTBF by roughly 88% when it hits everything and by about a quarter when the pilot ring catches it. The metric to watch is the pilot ring’s failure count against its own baseline.
Automate Remediation with Scripts
Automated remediation can resolve known problems before they lead to prolonged disruption or repeated support tickets. For example, a PowerShell script can check whether an approved Windows service is stopped unexpectedly, collect diagnostic details, and restart it when predefined conditions are met.
Other useful actions include alerting administrators when a system disk approaches capacity or restoring a verified configuration after an unintended change. That prevents failures caused by full disks and stalled updates, which improves MTBF and cuts MTTR.
Apply controls so scripts do not repeatedly restart a failing service or conceal a deeper problem. Log every action and escalate failures that persist after remediation.
Track MTTR to see whether automated recovery reduces restoration time. Automation works best for understood failure patterns with tested remediation steps and limits.
Monitor Endpoint Reliability Trends
Collect failure events continuously. Chart MTBF per ring, device model and OS build, and alert when a figure falls well below its baseline, for example 30% week over week. Continuous data lets you catch a bad update on day one. Follow the same measurement policy throughout. The metric to watch is MTBF trend per group.
How Do MTBF and MTTR Affect System Availability?
Reliability is how long a system runs without failing. Availability measures the proportion of time it remains operational and accessible when users need it. A system can have a high MTBF and still have poor availability if each incident takes a long time to resolve.
MTBF measures system reliability, and MTTR measures how fast you recover. Availability combines both, which is why a system that fails often but recovers in seconds can beat one that rarely fails but takes a day to fix.
Availability targets are often expressed as “nines.”, and each level translates directly into allowed downtime:
| Availability | Downtime per year | Downtime per month | Common name |
|---|---|---|---|
| 99.9% | 8.76 hours | 43.2 minutes | Three nines |
| 99.99% | 52.6 minutes | 4.3 minutes | Four nines |
| 99.999% | 5.26 minutes | 26 seconds | Five nines |
| 99.9999% | 31.5 seconds | 2.6 seconds | Six nines |
Each extra nine cuts allowed downtime by a factor of ten and takes much more effort to reach. Uptime of 99.9% sounds high, but it still allows almost nine hours of unplanned downtime a year. Whether you can hit a target depends on both MTBF and MTTR.
The Availability Formula: MTBF ÷ (MTBF + MTTR)
For a repairable system, a commonly used availability estimate is:
Availability = MTBF ÷ (MTBF + MTTR) × 100
For example, if a server has an MTBF of 720 hours and an MTTR of 2 hours:
Availability = 720 ÷ (720 + 2) × 100 = 99.72%
You can improve availability in two ways:
- Halve MTTR: Reducing repair time from 2 hours to 1 hour raises availability to 720 ÷ 721 × 100, or approximately 99.86%.
- Double MTBF: Increasing MTBF from 720 hours to 1,440 hours raises availability to 1,440 ÷ 1,442 × 100, or approximately 99.86%.
Both changes improve availability, but doubling MTBF also means fewer incidents over the same amount of operating time. That reduces disruption for users and the workload on IT support teams.
What are the Common Challenges When Calculating MTBF?
Accurate MTBF calculations depend on accurate incident data and consistent measurement rules. If your records miss failures or count events incorrectly, the result can be misleading.
Common challenges include:
- Poor data quality: Event logs roll over, and offline devices don’t report. If a laptop’s System log only holds a week of events, your 30-day count is wrong. Raise log retention or collect events centrally.
- Complex systems: A failure may originate in the operating system, a driver, an application, or a shared service. Without root cause analysis, you can’t assign the failure to the right place.
- An unsuitable measurement period: A short window may not capture enough failures to reveal a pattern. For example, measuring only the days immediately after Patch Tuesday may exaggerate the impact of an update or miss later problems. Use 30 days or more and compare like with like.
- Maintenance schedules: Planned reboots logged as unexpected shutdowns inflate the failure count. Filter them out using your maintenance window.
- Changing conditions: An operating system upgrade, driver change, or major application release can alter failure patterns. Record these changes and establish a new baseline when necessary.
- Inconsistent failure definitions: Different teams may count a service restart, application crash, and full system outage differently. Agree on what qualifies as a failure and how related events are grouped.
FAQs
What Does MTBF Stand for?
MTBF stands for mean time between failures. It’s the average operating time between unplanned failures of a repairable system. You can calculate it by dividing total operating time by the number of failures for an endpoint, a server or an application.
What is a Good MTBF?
There is no universal MTBF value that every system should meet. A good MTBF depends on the system and on what counts as a failure for it. Compare MTBF against your own baseline, ideally by device model, operating system build, and application version. A figure that’s rising is a good sign. One that falls after a change needs attention.
Is a Higher MTBF Better?
Generally, yes. A higher MTBF means more operating time between failures, fewer incidents and less unplanned downtime. However, MTBF does not measure the severity of failures or how long recovery takes. Review it with incident impact, downtime, availability, and mean time to remediate (MTTR).
What is the Difference Between MTBF and MTTR?
MTBF is the average operating time a system runs between failures. MTTR is the average time it takes to restore service after a failure. MTBF tells you how often you’ll have an outage. MTTR tells you how long it will last. Tracking both helps IT teams understand whether systems are failing less often and whether their response and repair processes are becoming more effective.
Do Planned Patch Reboots Count Against MTBF?
No. A reboot inside a planned maintenance window is scheduled work, not a failure. If the reboot hangs or ends in a blue screen, that outcome does count, because the system failed to come back as planned.
How Often Should MTBF be Recalculated?
Monthly works for most fleets because it covers a full Patch Tuesday cycle. Recalculate weekly for pilot rings after each update. Recalculate again whenever you change your OS version, patch cadence or failure definition.
How Action1 Helps Improve MTBF Across Endpoint Fleets
Action1 is a cloud-native autonomous endpoint management platform that helps IT teams manage software updates, address vulnerabilities, and reduce recurring endpoint issues. By automating patching, vulnerability remediation, and improving endpoint visibility, Action1 can help prevent some software-related failures and support more reliable operations. These improvements can contribute to a higher mean time between failures (MTBF), although the actual impact depends on the failures involved and how effectively teams address their causes.
Action1 brings patch management, vulnerability management, scripting, reporting, and real-time endpoint visibility together in one platform. It supports Windows, macOS, and Linux endpoints, as well as third-party applications. You can manage laptops, desktops, servers, virtual machines, and cloud workloads, whether they’re on-premises or used by remote employees.
Instead of manually checking devices and coordinating every update, your IT team can identify missing patches, prioritize vulnerabilities, control how updates are deployed, and automate recurring maintenance tasks. These capabilities help you address known issues and apply fixes before they cause problems. If a problem keeps recurring, scripting can help automate an approved remediation task.
Action1 is also designed to simplify deployment. You don’t need on-premises hardware, complex infrastructure, or a VPN to manage remote endpoints. You can create an account and deploy the Action1 agent to start managing supported devices. The platform is free for the first 200 endpoints, so smaller IT teams can explore its capabilities at zero cost.
By helping your team identify risks, apply fixes consistently, and reduce recurring software problems, Action1 can support a more proactive approach to endpoint reliability.
Here is how each capability connects to reliability.
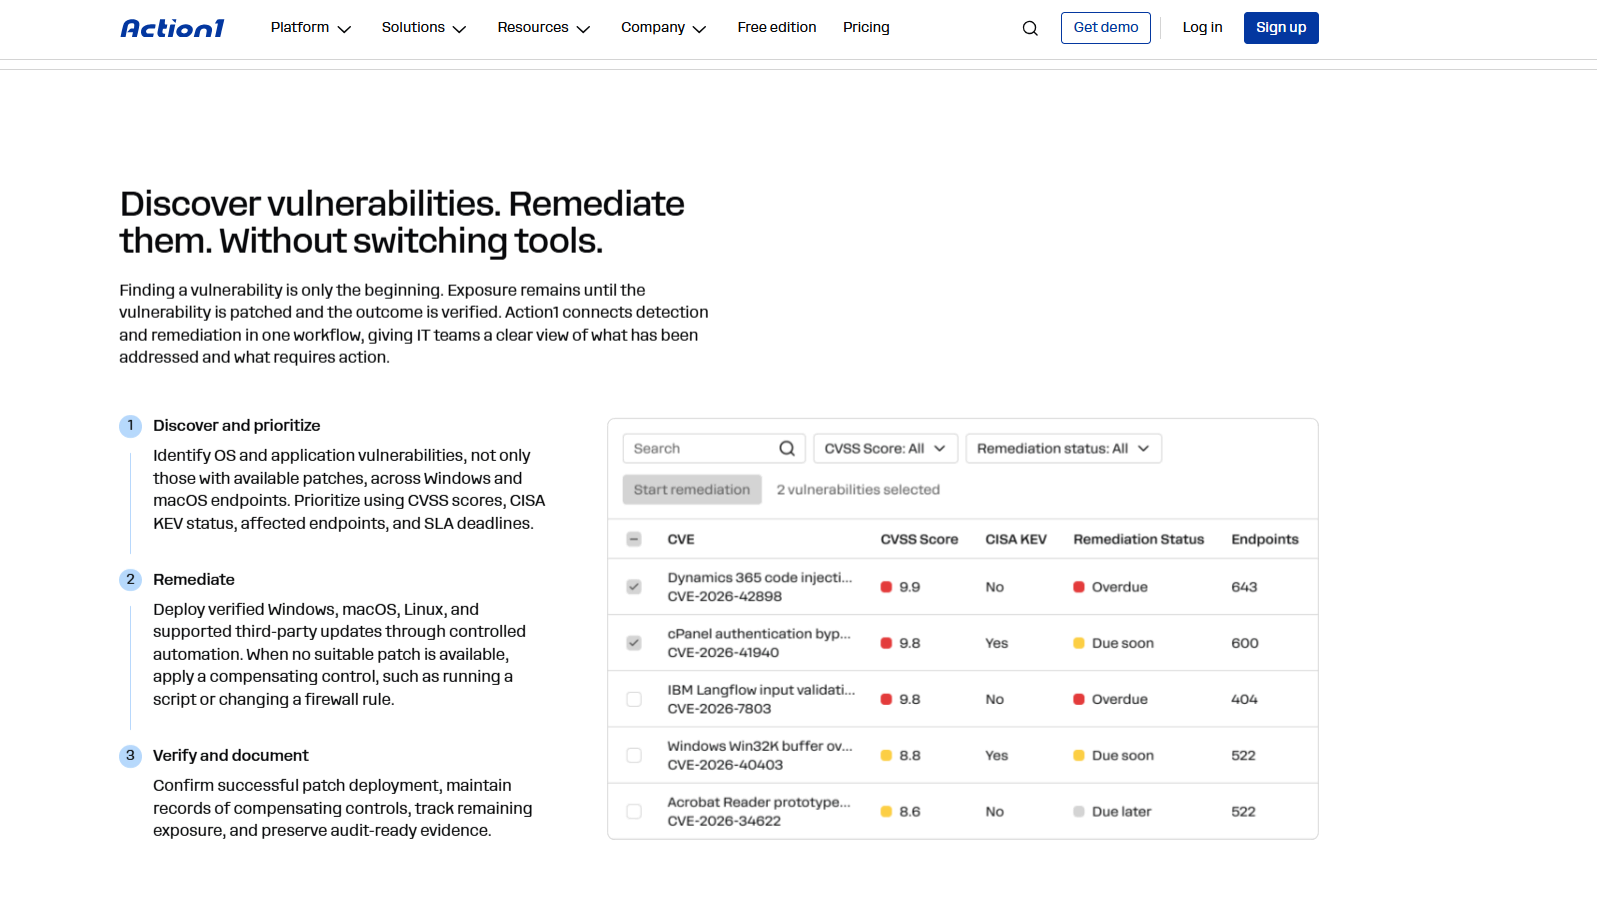
- End-to-end patching and vulnerability remediation: Action1 identifies vulnerable operating systems and third-party applications in real time using CVE numbers, CVSS scores, active exploitation based on CISA KEV, and known ransomware campaigns. It draws vulnerability intelligence from multiple sources, including VulnCheck NVD++, NIST NVD, CISA KEV, MSRC and vendor release notes. You can apply available patches, remove unsupported or legacy software, track active vulnerabilities against SLAs, and centralize documentation of compensating controls when a vulnerability can’t be patched yet. It focuses on vulnerability remediation, helping you reduce the risk of cyberattacks by fixing known vulnerabilities, addressing software bugs, and deploying updates that can improve system stability and prevent unexpected crashes.
- OS and third-party patching: You can automate Windows, macOS, Linux and supported third-party application patching, with approval rules, optional approval delays, manual approval for critical systems, scheduling, and patch compliance visibility. Approval delays and manual approval for critical systems reduce update-related failures, and compliance visibility shows where unpatched risk is piling up. Both support a higher MTBF. For your team, patching becomes a predictable routine.
- Autonomous patching through update rings: You can configure phased patch deployments in Action1 to move updates through deployment rings based on success metrics. Once you set up the automation and schedule regular maintenance windows, Action1 automatically starts, manages, and completes the patching process without manual intervention. For emergency patches, you can trigger an existing automation, and Action1 handles the deployment process. Action1 automatically advances qualified updates from inner to outer rings based on success metrics. If an update causes problems in an earlier ring, it is prevented from progressing to more devices. This helps limit the potential impact of regression failures across your fleet. For your team, that can mean fewer widespread, update-related incidents after Patch Tuesday and less time spent coordinating patch deployments manually.
- P2P patch distribution: Action1 uses P2P distribution to reduce external bandwidth usage, especially when patching hundreds or thousands of endpoints. When one endpoint downloads a patch, it can share that patch with other endpoints on the same local network, so they don’t all have to download it separately. It addresses slow, interrupted downloads in bandwidth-constrained locations, which can leave endpoints half-updated. Faster deployment means fewer endpoints stuck in a bad state, and you don’t need to maintain local cache servers to get there.
- Privately maintained software repository: Action1 uses a privately maintained, secure repository for supported third-party software instead of relying on community-maintained repositories. This addresses software supply chain risk, where an untrusted package source can lead to failure or a compromise. Controlled delivery means fewer surprises in what lands on your endpoints, which protects MTBF.
- Scripting and automation: Action1 has a built-in script library with ready-to-use scripts, but you can also create and run your own custom scripts. This gives IT teams the flexibility to automate common maintenance tasks or build scripts for their specific needs, without having to write everything from scratch.
- Cloud-native architecture: Action1 works across office, remote, server, and cloud workloads without VPN connectivity, on-premises appliances, or dedicated cache servers. This makes Action1 a cost-effective solution as you don’t have to put any money on the table for additional hardware or infrastructure, whether you’re managing 100 endpoints or more than 100,000. That also means lower infrastructure and maintenance overhead, and fewer on-premises components that could become operational dependencies of their own. Every extra dependency lowers combined MTBF in a series chain, so removing them helps.
- Offline endpoint catch-up: If an endpoint is offline when a scheduled action is due, Action1 can run the missed schedule when the endpoint reconnects, according to the configured missed-schedule deadline.
- Real-time asset and software visibility: You can see installed applications and versions, operating system information, hardware details, configuration information and other endpoint data for your fleet, and you can deploy prepackaged and custom software. This information helps you identify common factors behind failures, such as a specific software version, OS build, or a hardware model. Finding the pattern is the first step in a root cause analysis. Your team gets an answer to “what do these failing devices have in common?” in minutes.
- Real-time and customizable reporting: Action1 provides more than 100 built-in reports covering patching, vulnerabilities, software and hardware inventory, security configuration, and other endpoint data. You can clone and customize existing reports or build new reports from PowerShell output, such as the MTBF script earlier in this guide. For connected endpoints, reports use real-time data. For offline endpoints, Action1 supplements the report with cached data from their last connection. Summary and drill-down views, CSV export, and email subscriptions help with operational analysis, compliance tracking and audit preparation.
- Free tier: Action1 includes a fully featured free tier for up to 200 endpoints, with no time limit. This gives your team a way to evaluate its endpoint management and patching workflows in a real environment.
Improving MTBF isn’t just about fixing endpoints after they fail. You need to identify risk early, control changes, remediate known problems, keep offline endpoints from falling behind, prevent recurring issues, and have enough visibility to see where reliability is getting worse. That’s the work Action1 is built to support.
Ready to see your own MTBF improve? Start free with up to 200 endpoints or request a demo to see how Action1 can help your team reduce preventable failures and improve endpoint reliability.